


Marketing Metrics

Marketing Metrics
We track various metrics
Email Metrics
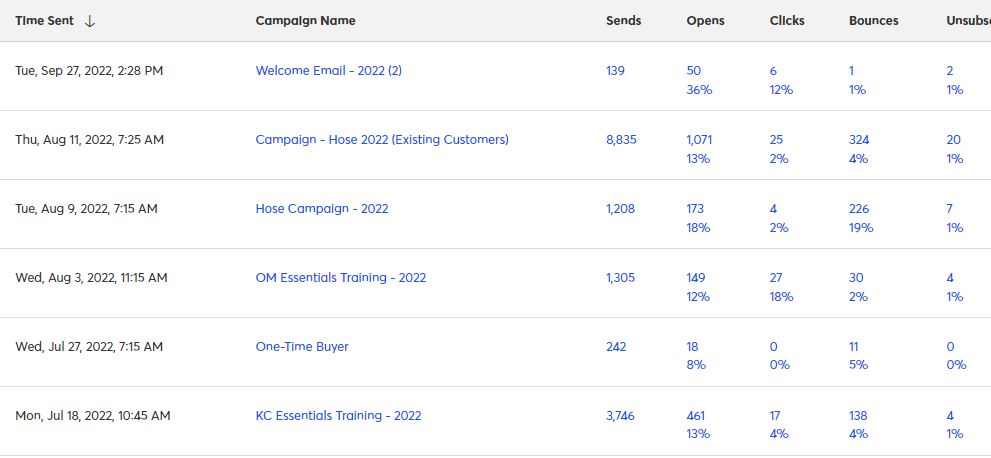
- Opens %
- Click %
- Unsubscribe %
- Bounce %
Website Metrics

Users - Users who have initiated at least one session during the date range
- New Users - The number of first-time users during the selected date range
- Sessions - Total number of Sessions within the date range. A session is the period time a user is actively engaged with your website, app, etc. All usage data (Screen Views, Events, Ecommerce, etc.) is associated with a session
- Number of Sessions per User - Pageviews is the total number of pages viewed. Repeated views of a single page are counted
- Pageviews - Pages/Session (Average Page Depth) is the average number of pages viewed during a session. Repeated views of a single page are counted
- Pages/Session - Pages/Session (Average Page Depth) is the average number of pages viewed during a session. Repeated views of a single page are counted
- Avg. Session Duration - The average length of a Session
- Bounce Rate - The percentage of single-page sessions in which there was no interaction with the page. A bounced session has a duration of 0 seconds
Web Order Metrics
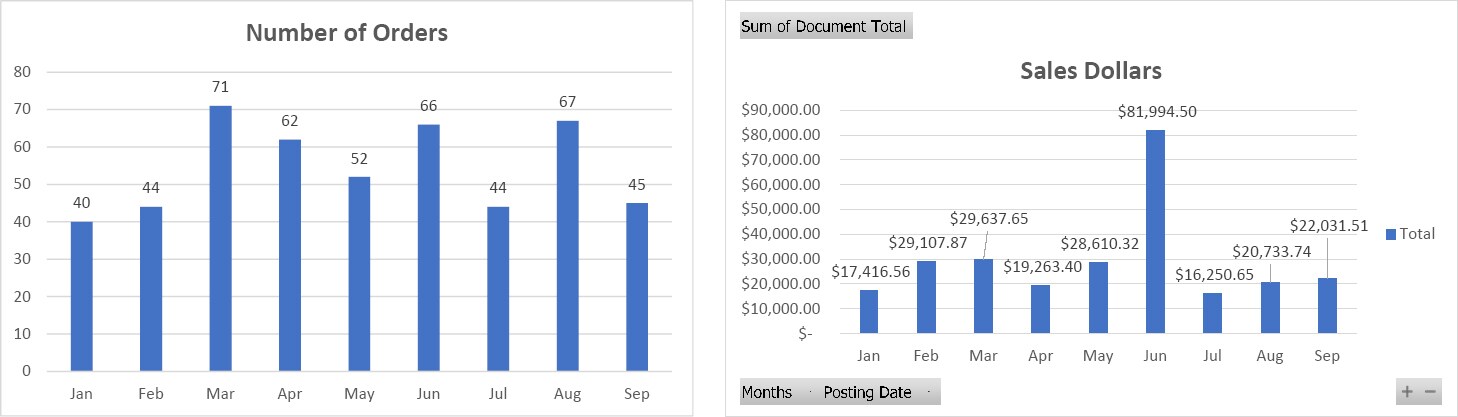
Since the implementation of the new e-commerce platform, we've been pushing content to customers to make them aware of the search and purchasing capabilities that came with it.
- Number of Orders
- Sales
Direct/Indirect Marketing Efforts
This report looks at sales compared to our marketing campaign timeline. It looks at the sales made to both the contact person and the business partner that they are associated with. For example, direct influence would be if the if the contact person submitted a quote or made a purchase during our product/service campaign timeline and an indirect influence would be if the business partner submitted a quote or made a purchase during our product/service campaign timeline.
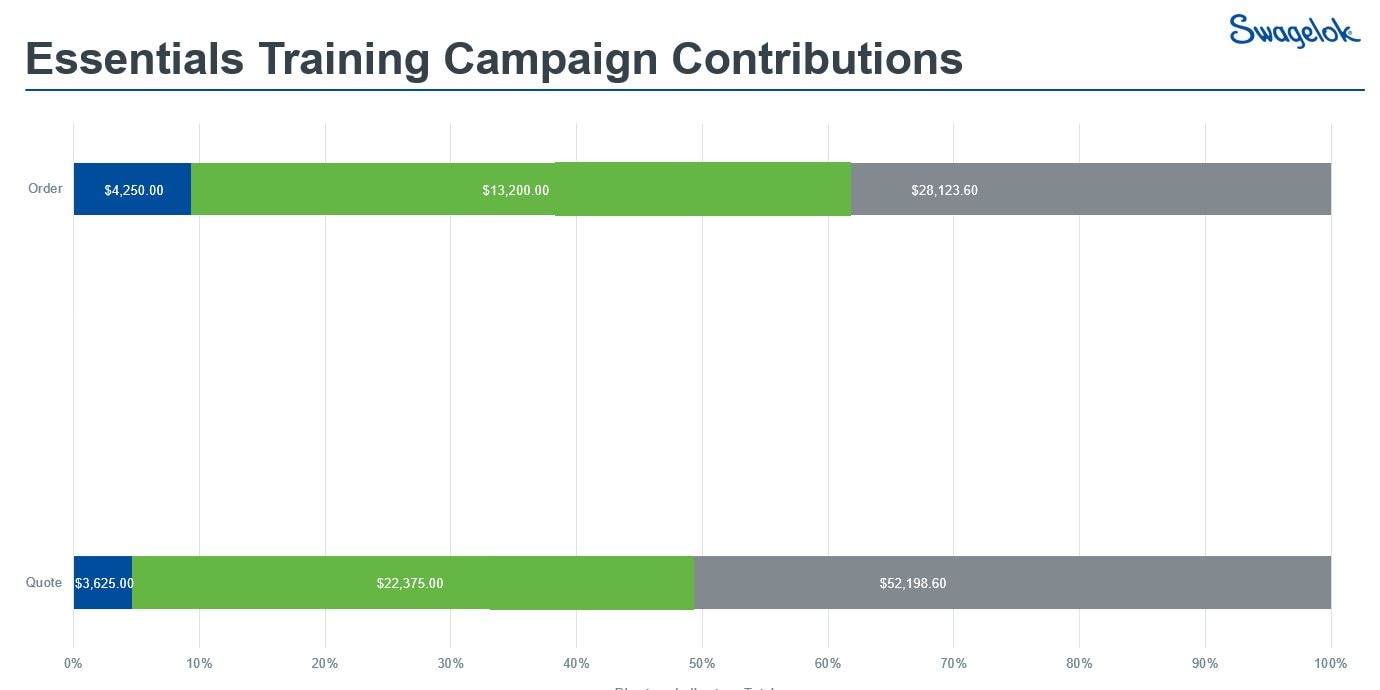
Example: Of the $28,123.60 of training orders placed in Q2 2022, $4,250 of those were placed by the contact person we directly contacted about training via our marketing communications and $13,200 were placed by the business partners of the contact person we contacted. Thus we directly/indirectly influenced 62% of training sales in Q2 2022.
SAP DSG Tracking
We setup queries in SAP to track progress with DSG contacts. This looks at the BP Code, BP Name, Industry, Name, Position, Number, Email, Sales, Order Number, and Activities. This report gives us a quick snapshot of these new customers we're trying to break into.

Decipher the Clues Below to Find the Following Topic Locations
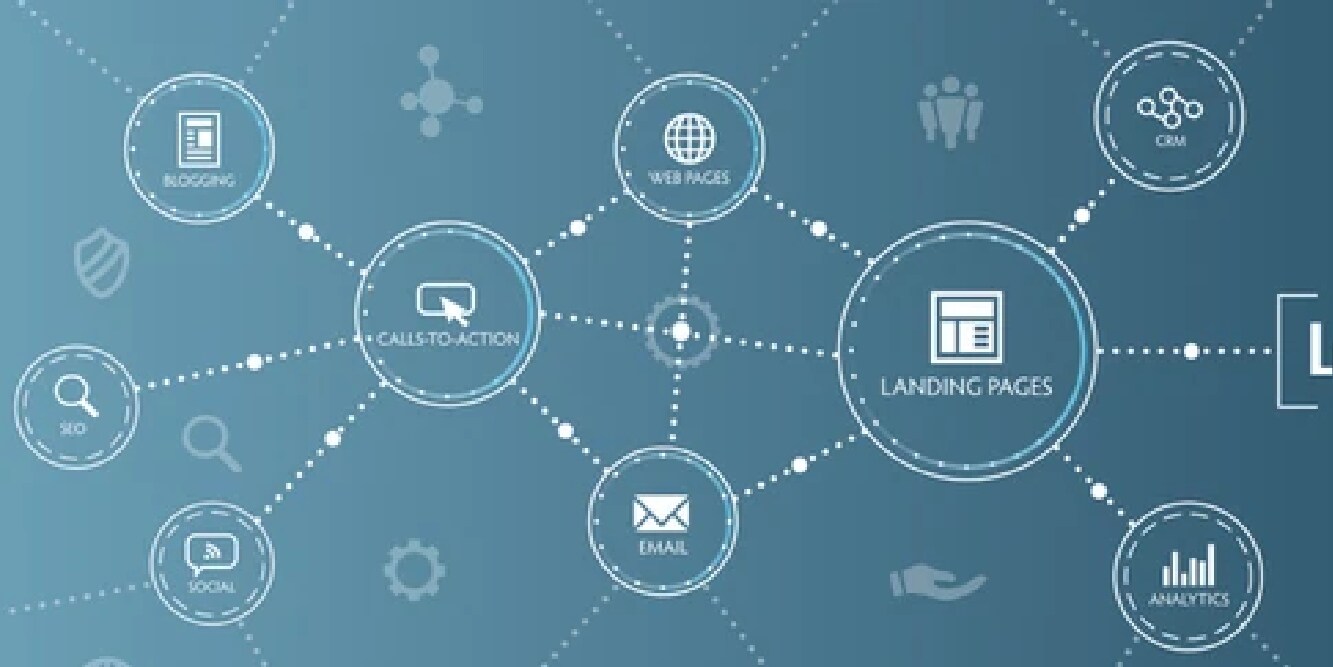
Lead Generation
Don't fret, don't fuss
Don't go into a rage
If you want a minute to relax
Walk out back to the ______
Marketing Campaigns
If you need more cowbell
Like Christopher Walken
Go to the place
Where the customers __________

Marketing Metrics
Laughter is common
And loud noises your friend
Back in the location
Where tubes get their bend
(Don't even try to cheat by clicking on the image links above!)